The graph shows the monthly sales of a new assortment of shampoos. In January, the number of shampoos sold was 1,000. Over the next two months, sales rose to 2000. However, in April, sales fell sharply to 800. Then, shampoo sales began to grow gradually over the next three months, increasing to 1200 shampoos by July. In August, sales rose and peaked. Unfortunately, the number of sales fell sharply, from September it fell to almost 1300. A fairly quick recovery brought back the sales of more than 1500 shampoos sold, and further steady progress led to the fact that by December they again rose above 2000.
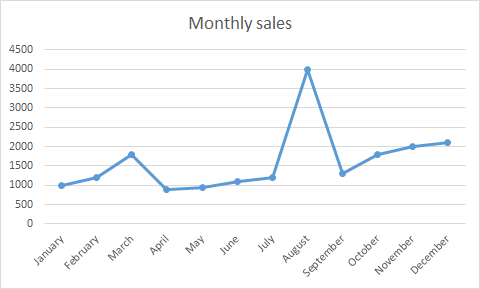
This graph shows how the sales of new shampoos have changed over the course of the year. In January, the number of shampoos sold was 1,000. Then, within two months, there was an increase in sales and in March they reached 1900 however, in April, sales fell to 900, after which there was a slight increase and within three months, sales increased to 1200 From July to August, there has been a strong sales growth which peaked at 4,000. In September, sales fell to 1,400, then a slight increase was observed over the course of three months, and at the end of the year sales amounted to 2100 shampoos.
The graph shows the monthly sales of a new assortment of shampoos. In January, the number of shampoos sold was 1,000. Over the next two months, sales rose to 2000. However, in April, sales fell sharply to 800. Then, shampoo sales began to grow gradually over the next three months, increasing to 1200 shampoos by July. In August, sales rose and peaked. Unfortunately, the number of sales fell sharply, from September it fell to almost 1300. A fairly quick recovery brought back the sales of more than 1500 shampoos sold, and further steady progress led to the fact that by December they again rose above 2000.
ОтветитьУдалитьThis graph shows how the sales of new shampoos have changed over the course of the year. In January, the number of shampoos sold was 1,000. Then, within two months, there was an increase in sales and in March they reached 1900 however, in April, sales fell to 900, after which there was a slight increase and within three months, sales increased to 1200 From July to August, there has been a strong sales growth which peaked at 4,000. In September, sales fell to 1,400, then a slight increase was observed over the course of three months, and at the end of the year sales amounted to 2100 shampoos.
ОтветитьУдалить