The graph above shows changes in the birth rate in Russia from 1990 to 2022. Summarize the information by selecting and reporting the main features. Write at least 150 words.
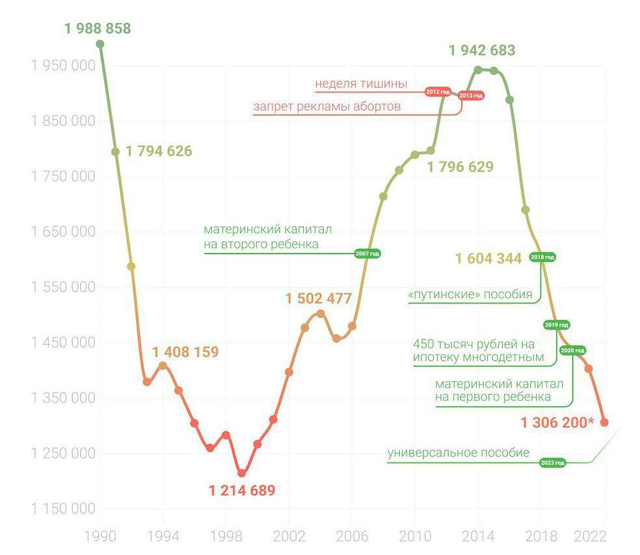
The graph illustrates fluctuations of Russia's birth rate from 1990 to 2022. As it can be seen, over the period from 1990 to 1993 the birth rate fell rapidly. After a moderate increase in 1994 the rate hit a low in 1999. From 1999 there was an upward trend in the number of births, and it reached over 1.5 million people in 2004. Although over the next year we can see a slight drop in the number of births. Since 2006 the birth rate began to climb annually. Maternity capital payments for the second child introduced in 2007 led to a rise in the birth rate and in 2011 the number of newborns already amounted to 1.7 million people per year. From 2012 to 2013 there was a stabilization period followed with a growth in 2014 and the quantity of newborns reached its peak amounting to more than 1.9 million people pet year between 1999 and 2022. Over the next 8 years the number of newborns decreased by more than 600 thousand. Despite the considerable number of benefits introduced since 2018, the decline trend in the birth rate continues.
The graph illustrates fluctuations of Russia's birth rate from 1990 to 2022.
ОтветитьУдалитьAs it can be seen, over the period from 1990 to 1993 the birth rate fell rapidly.
After a moderate increase in 1994 the rate hit a low in 1999.
From 1999 there was an upward trend in the number of births, and it reached over 1.5 million people in 2004.
Although over the next year we can see a slight drop in the number of births. Since 2006 the birth rate began to climb annually.
Maternity capital payments for the second child introduced in 2007 led to a rise in the birth rate and in 2011 the number of newborns already amounted to 1.7 million people per year.
From 2012 to 2013 there was a stabilization period followed with a growth in 2014 and the quantity of newborns reached its peak amounting to more than 1.9 million people pet year between 1999 and 2022.
Over the next 8 years the number of newborns decreased by more than 600 thousand.
Despite the considerable number of benefits introduced since 2018, the decline trend in the birth rate continues.